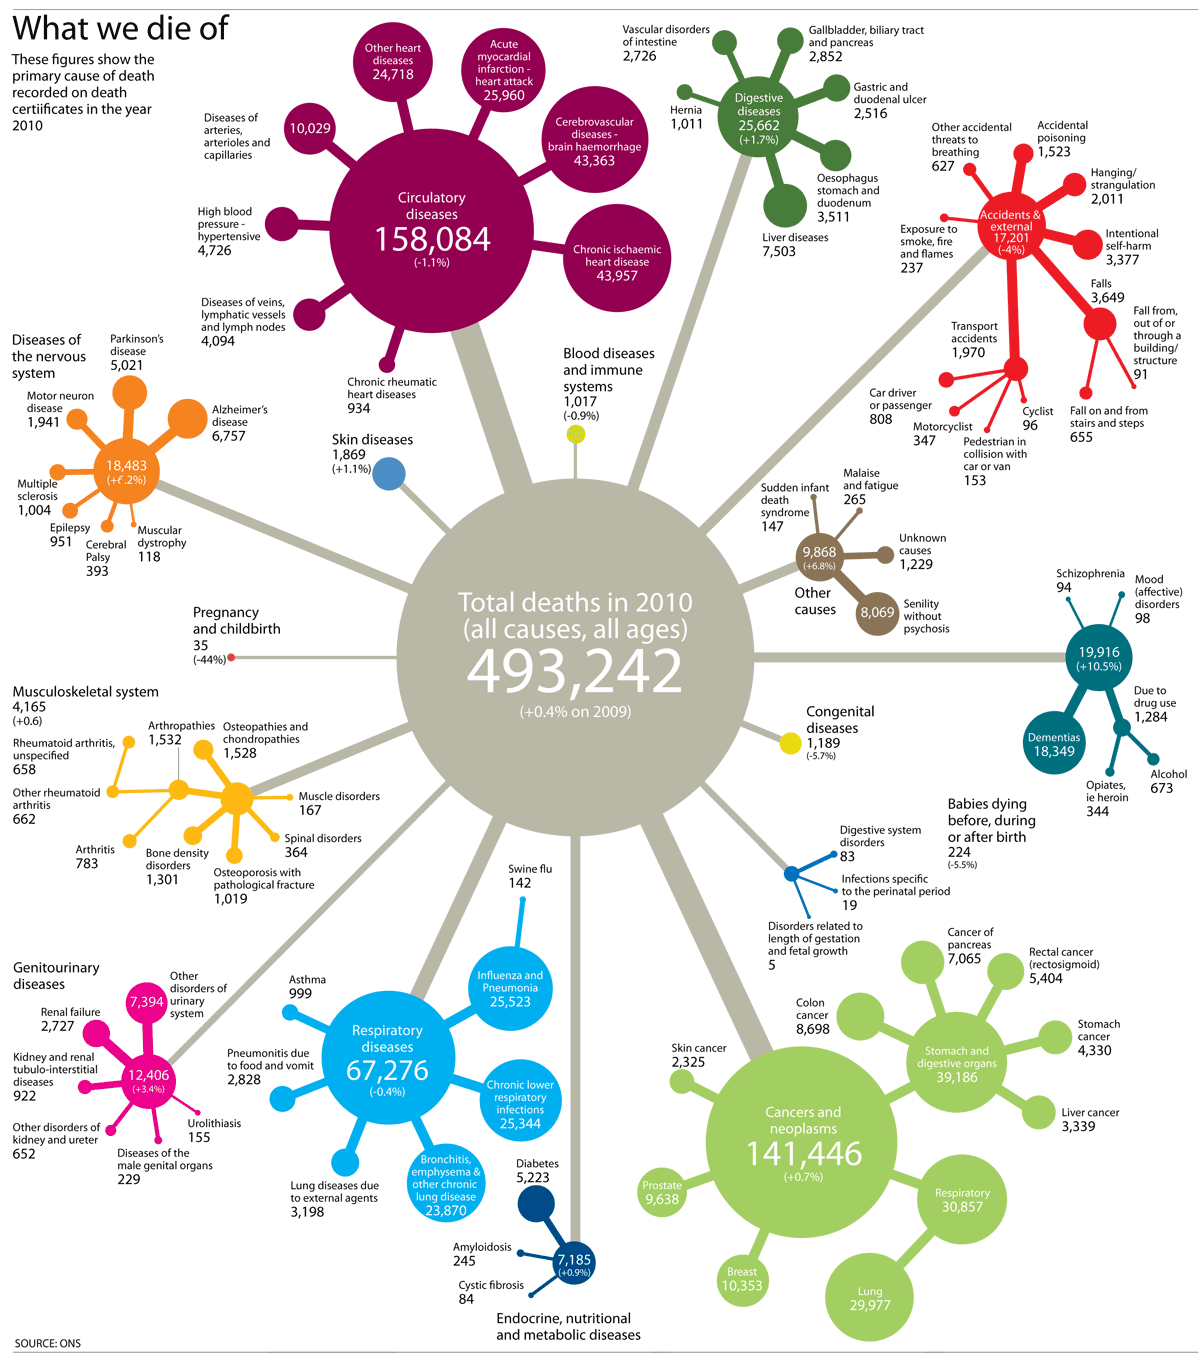
The annual mortality statistics published by the Office for National Statistics are out today for 2010 - and provides an incredibly detailed breakdown of the most morbid dataset imagineable.
We may worry about murders or swine flu, but the big killers of heart disease and cancer are much more significant in terms of public health. What is also striking is how constant many of these numbers of deaths are - why do around 17,000 people die each year in accidents, for instance? Why do around 200 people accidentally drown every year?
Besides the graphic above (which you can download as a PDF), we've summarised two of the datasets below: major causes of death and deaths from external causes - ie, accidents or assaults. If you want to find out how many people died after being stung by bees or falling down stairs, this is the place to look.
Guardian health editor Sarah Boseley says the striking thing is the numbers dying of dementia and Alzheimers - which are confusingly listed separately on the ONS spreadsheet but rightly put together in the analysis.
The latest figures from the Office for National Statistics show an 11.% rise in dementia deaths in the last year – between 2009 and 2010 - to a total of 25,106. More than two-thirds – 18,349 - were in women, in part because they live longer than men.
Alzheimer's and dementia are now the third leading cause of death for women, after heart disease and stroke. Falls in other, more preventable and treatable, diseases are largely responsible for a 26% rise in dementia deaths over the five years between 2005 and 2010. In the same period, heart disease deaths dropped by 30% in women. Diseases of the urinary system – also linked to old age – increased by 8.1% in that time and lung cancer deaths rose by 3.5%, as smoking continued to take its long-term toll, but most other trends were down.
Among men, deaths from dementia and Alzheimer's have risen by 21% between 2005 and 2010, while liver disease has show the other significant increase – up 3%. As in women, heart disease deaths fell substantially over the same period – by 26% - but they are still the leading cause of death, killing 40,721 men in 2010 and accounting for 17% of all male deaths. Dementia comes eighth among the leading causes of male deaths, accounting for 7,347 last year
Essentially, other causes of death are going down - and people have to die of something.
And, whatever we may worry about, this is one of the safest times to be alive, ever - as the chart below shows.
Roll over line for numbers
The data itself comes from death certificates and records the primary cause of death - which is why the influenza numbers are lower than other estimates. If you get flu, which then lowers your resistance enough for pneumonia to kill you, for instance, pneumonia would be the main cause of death recorded.
The NHS has visualised previous years' data already with its atlas of risk.
Can you do something better? The full data is below for you to download.
Data summary
Major causes of death, 2010
Click heading to sort table. Download this data
|
Cause of death
|
MALE
|
FEMALE
|
2010 TOTAL
|
Rate per 100,000 pop
|
% change, 2009-10
|
|
|
| All causes, all ages |
237,916 |
255,326 |
493,242 |
892.90 |
0.39 |
| All causes, ages under 28 days |
1,184 |
964 |
2,148 |
|
-4.58 |
| All causes, ages 28 days and over |
236,732 |
254,362 |
491,094 |
|
0.41 |
| Circulatory diseases |
77,260 |
80,824 |
158,084 |
286.17 |
-1.06 |
| Cancers and neoplasms |
74,267 |
67,179 |
141,446 |
256.05 |
0.68 |
| Respiratory diseases |
31,563 |
35,713 |
67,276 |
121.79 |
-0.42 |
| Digestive diseases |
12,164 |
13,498 |
25,662 |
46.46 |
1.71 |
| Mental and behavioural disorders |
6,299 |
13,617 |
19,916 |
36.05 |
10.52 |
| Death not caused by disease |
10,545 |
6,656 |
17,201 |
31.14 |
-3.79 |
| Diseases of the nervous system |
8,551 |
9,932 |
18,483 |
33.46 |
6.18 |
| Genitourinary diseases |
4,893 |
7,513 |
12,406 |
22.46 |
3.40 |
| Other causes |
2,534 |
7,334 |
9,868 |
17.86 |
6.76 |
| Endocrine, nutritional and metabolic diseases |
3,232 |
3,953 |
7,185 |
13.01 |
0.87 |
| Infectious and parasitic diseases |
2,284 |
2,753 |
5,037 |
9.12 |
-12.40 |
| Musculoskeletal system |
1,352 |
2,813 |
4,165 |
7.54 |
0.58 |
| Skin diseases |
629 |
1,240 |
1,869 |
3.38 |
1.08 |
| Congenital diseases and chromasomal abnormalities |
604 |
585 |
1,189 |
2.15 |
-5.71 |
| Blood diseases and immune systems |
415 |
602 |
1,017 |
1.84 |
-0.88 |
| Babies dying before, during or after birth |
126 |
98 |
224 |
0.41 |
-5.49 |
| Pregnancy and childbirth |
|
35 |
35 |
0.06 |
-44.44 |
| Diseases of the ear and mastoid process |
9 |
11 |
20 |
0.04 |
-31.03 |
| Diseases of the eye and adnexa |
5 |
6 |
11 |
0.02 |
120.00 |
Accidents and external causes
Click heading to sort table. Download this data
|
No.
|
Cause
|
Type
|
MALE
|
FEMALE
|
2010
|
2009
|
2008
|
|
|
| 1 |
External causes of morbidity |
TOTAL |
10,545 |
6,656 |
17,201 |
17,878 |
18,048 |
| 2 |
Death from injury or poisoning, not known if deliberate or not |
TOTAL |
249 |
105 |
354 |
386 |
420 |
| 3 |
Accidents total |
Acc. |
6,354 |
5,084 |
11,438 |
11,917 |
12,231 |
| 4 |
Transport accidents total |
Acc., transport |
1,453 |
517 |
1,970 |
2,284 |
2,676 |
| 5 |
Pedestrian injured in transport accident |
Acc., transport, pedest. |
265 |
133 |
398 |
469 |
604 |
| 6 |
Pedestrian in collision with cycle |
Acc., transport, pedest. |
|
2 |
2 |
0 |
3 |
| 7 |
Pedestrian in collision with motorbike |
Acc., transport, pedest. |
3 |
2 |
5 |
10 |
22 |
| 8 |
Pedestrian in collision with car or van |
Acc., transport, pedest. |
85 |
48 |
133 |
153 |
260 |
| 9 |
Pedestrian in collision with lorry or bus |
Acc., transport, pedest. |
32 |
23 |
55 |
79 |
85 |
| 10 |
Pedestrian injured hit by train |
Acc., transport, pedest. |
33 |
6 |
39 |
35 |
48 |
| 11 |
Cyclist in transport accident |
Acc., transport, cycle |
73 |
23 |
96 |
113 |
118 |
| 12 |
Cyclist injured in collision with car or van |
Acc., transport, cycle |
24 |
3 |
27 |
27 |
36 |
| 13 |
Motorcyclist in transport accident |
Acc., transport, m' cycle |
329 |
18 |
347 |
431 |
477 |
| 14 |
Motorcyclist in collision with car or van |
Acc., transport, m' cycle |
78 |
4 |
82 |
118 |
163 |
| 15 |
Car occupant injured in transport accident |
Acc., transport, car |
550 |
258 |
808 |
922 |
1,111 |
| 16 |
Car occupant injured in collision with car or van |
Acc., transport, car |
67 |
37 |
104 |
116 |
173 |
| 17 |
Car occupant in collision with stationary object |
Acc., transport, car |
161 |
42 |
203 |
223 |
297 |
| 18 |
Water transport accidents |
Acc., transport |
10 |
4 |
14 |
23 |
29 |
| 19 |
Air and space transport accidents |
Acc., transport |
19 |
3 |
22 |
40 |
21 |
| 20 |
Falls total |
Acc., Fall |
1,853 |
1,796 |
3,649 |
3,593 |
3,459 |
| 21 |
Fall on and from stairs and steps |
Acc., Fall |
351 |
304 |
655 |
644 |
642 |
| 22 |
Fall on and from ladder |
Acc., Fall |
47 |
6 |
53 |
55 |
60 |
| 23 |
Fall from, out of or through building/structure |
Acc., Fall |
75 |
16 |
91 |
93 |
112 |
| 24 |
Fall from cliff |
Acc., Fall |
|
9 |
9 |
18 |
5 |
| 25 |
Inanimate objects |
Inan. Obj |
106 |
26 |
132 |
138 |
125 |
| 26 |
Struck by thrown, projected or falling object |
Inan. Obj |
30 |
6 |
36 |
39 |
38 |
| 27 |
Animate objects total |
Animals, people |
12 |
11 |
23 |
24 |
24 |
| 28 |
Hit, struck, kicked, twisted, bitten or scratched by another |
Animals, people |
4 |
3 |
7 |
2 |
5 |
| 29 |
Bitten by rat |
Animals |
|
|
0 |
0 |
0 |
| 30 |
Bitten by dog |
Animals |
|
3 |
3 |
5 |
4 |
| 31 |
Bitten or struck by other mammals |
Animals |
4 |
3 |
7 |
9 |
8 |
| 32 |
Accidental drowning total |
Acc. Drown |
170 |
47 |
217 |
205 |
195 |
| 33 |
In bath tub |
Acc. Drown |
9 |
20 |
29 |
33 |
22 |
| 34 |
Drowning in swimming pool, or falling in |
Acc. Drown |
3 |
|
3 |
9 |
1 |
| 35 |
Drowning in natural water |
Acc. Drown |
58 |
10 |
68 |
42 |
50 |
| 36 |
Other accidental threats to breathing |
Acc. Suff |
383 |
244 |
627 |
654 |
638 |
| 37 |
Accidental suffocation in bed |
Acc. Suff |
2 |
3 |
5 |
11 |
11 |
| 38 |
Accidental hanging/strangulation |
Acc. Suff |
169 |
45 |
214 |
254 |
253 |
| 39 |
Inhalation of stomach contents |
Choking |
59 |
54 |
113 |
98 |
108 |
| 40 |
Inhalation and ingestion of food |
Choking |
100 |
103 |
203 |
182 |
176 |
| 41 |
Exposure to electric current, radiation and extreme ambient air temperature and pressure total |
Atmos |
35 |
2 |
37 |
33 |
21 |
| 42 |
Exposure to smoke, fire and flames |
Atmos |
123 |
114 |
237 |
279 |
282 |
| 43 |
Contact with heat and hot substances |
Atmos |
6 |
11 |
17 |
34 |
24 |
| 44 |
Contact with hornets, wasps and bees |
Atmos, insects |
3 |
2 |
5 |
4 |
2 |
| 45 |
Exposure to forces of nature |
Atmos, nature |
68 |
61 |
129 |
125 |
119 |
| 46 |
Exposure to excessive natural cold |
Atmos, nature, cold |
68 |
61 |
129 |
117 |
108 |
| 47 |
Victim of lightning |
Atmos |
|
|
0 |
1 |
0 |
| 48 |
Accidental poisoning total |
Acc. Poison |
1,076 |
447 |
1,523 |
1,537 |
1,429 |
| 49 |
Exposure to narcotics and hallucinogens |
Acc. Poison |
508 |
115 |
623 |
648 |
580 |
| 50 |
Accidental alcohol poisoning |
Acc. Poison |
130 |
58 |
188 |
179 |
170 |
| 51 |
Lack of food |
Starv- ation |
3 |
3 |
6 |
6 |
5 |
| 52 |
Intentional self-harm |
Suicide, harm |
2,613 |
764 |
3,377 |
3,457 |
3,438 |
| 53 |
Hanging/strangulation |
Suicide, harm |
1,664 |
347 |
2,011 |
2,079 |
2,045 |
| 54 |
Assault |
TOTAL |
211 |
108 |
319 |
318 |
338 |
| 55 |
Complications of medical and surgical care |
TOTAL |
218 |
215 |
433 |
462 |
366 |
• DATA: download the full spreadsheet
More open data
Data journalism and data visualisations from the Guardian
World government data
• Search the world's government data with our gateway
Development and aid data
• Search the world's global development data with our gateway
Can you do something with this data?
• Flickr Please post your visualisations and mash-ups on our Flickr group
• Contact us at data@guardian.co.uk
• Get the A-Z of data
• More at the Datastore directory
• Follow us on Twitter
• Like us on Facebook